telemetry.dev favicon

telemetry.dev

telemetry.dev is an OpenTelemetry-based observability platform for AI agents, providing end-to-end tracing across model calls, tool invocations, and MCP servers.

Code & ITTracing multi-turn AI agent workflows…Filtering traces by status,…Tracking p95 latency and failure…Ingesting telemetry via TypeScript and…
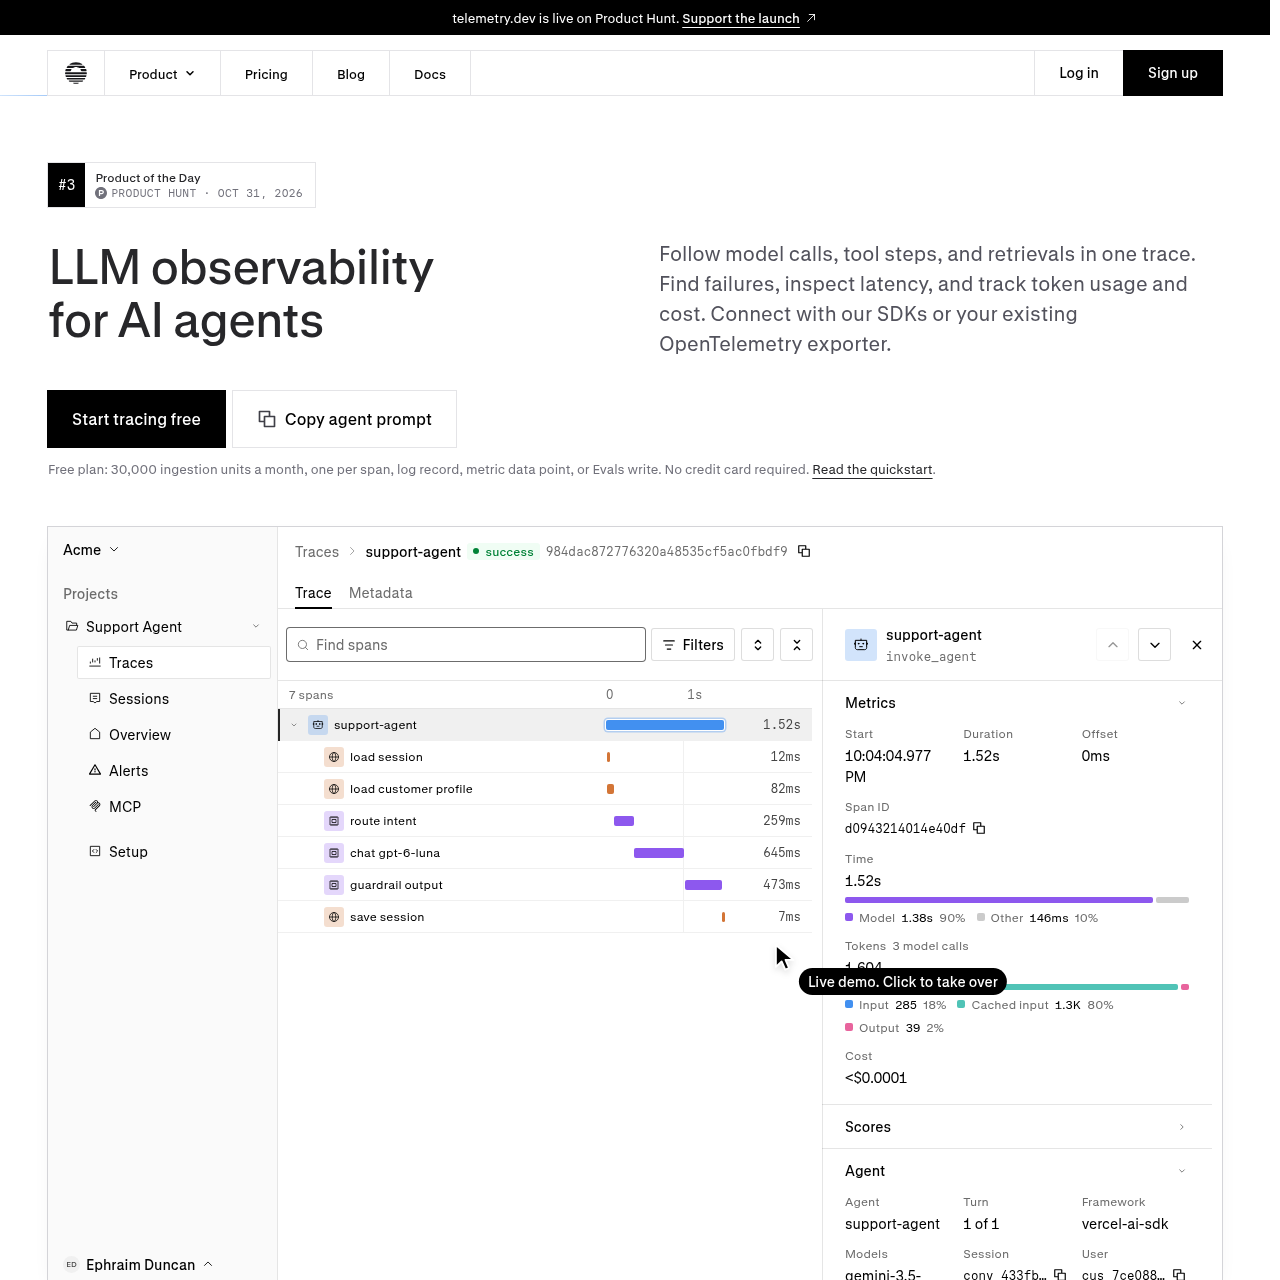
telemetry.dev product interface screenshot
Listed on AIToolly

What Is telemetry.dev? Product Overview

What the product does and how it is positioned

telemetry.dev provides observability and performance monitoring for AI applications and autonomous agents. Built on OpenTelemetry standards, the system consolidates model invocations, retrieval events, and tool executions into unified traces, allowing engineering teams to evaluate execution flow, locate tool timeouts, and diagnose operational failures.

The platform tracks token consumption, latency benchmarks, and cost metrics broken down by model provider, session, framework, and user. In addition to trace visualization, telemetry.dev includes email alerting for budget thresholds and agent loops, environment-level prompt capture controls, and a read-only MCP server for automated telemetry analysis.

What Can You Use telemetry.dev For?

Source-supported ways to use the product

AI Agent Execution Tracing

Software teams trace complex agent workflows across multi-step model responses and tool executions to identify latency bottlenecks and pinpoint failed calls.

Model Context Protocol Performance Monitoring

Developers analyze span counts, failure rates, and p95 latency for MCP tools on both client and server interfaces to maintain tool reliability.

LLM Spend and Token Accounting

Engineering managers monitor token volumes across input, cached, and output tokens to evaluate model costs across different providers and users.

How to Use telemetry.dev

The documented workflow, where available

  1. 1

    Stack Detection

    Identify the application framework, model providers, and runtime environment using a coding agent prompt or direct setup documentation.

  2. 2

    SDK or Exporter Installation

    Install the appropriate TypeScript SDK, Python SDK, framework-specific package, or configure an existing OpenTelemetry OTLP/HTTP exporter.

  3. 3

    Credential and Variable Configuration

    Configure the project API key and required telemetry endpoint settings within the target environment.

  4. 4

    Instrumented Trace Generation

    Execute AI requests to transmit spans, logs, and metric data points directly to the telemetry dashboard.

Agent Observability and MCP Analytics Architecture

telemetry.dev models the execution of generative AI applications by grouping individual operations into structured traces. Each trace captures the end-to-end execution path of an agent or request, mapping individual model prompts, completions, retrieval steps, and tool calls. Detailed metadata reveals step-level durations, token counts across cached and non-cached inputs, and error states, enabling engineers to locate latency bottlenecks and broken integrations.

The platform provides specialized observability for Model Context Protocol systems. It tracks tool executions from both the client and server perspective, aggregating metrics such as span counts, p95 durations, and failure percentages by tool method. Additionally, telemetry.dev provides a read-only MCP server endpoint, enabling external coding or analysis agents to inspect traces and error reports programmatically.

  • Traces map model calls, retrieval operations, and tool executions in a single visual timeline.
  • Detailed token breakdowns distinguish between standard input, cached input, and output generation.
  • MCP tooling metrics track failure percentages and p95 latencies across client and server implementations.
  • A read-only MCP server interface enables AI agents to query errors, latency data, and operational metrics.

What to Test Before Choosing telemetry.dev

Checks to run with your own material and workflow

  • Verify that your application stack supports integration through the TypeScript SDK, Python SDK, or a standard OTLP/HTTP exporter.
  • Confirm whether prompt capture needs to be disabled in production environments to comply with organizational data privacy requirements.
  • Check MCP tool failure rates and p95 latency metrics to identify integration timeouts across client and server calls.
  • Review alert configuration settings to ensure notifications are established for agent execution loops and budget limits.

telemetry.dev Sources and Last Checked

What was checked and when

Official source
https://telemetry.dev/
Last checked
Category
Code & IT

telemetry.dev Frequently Asked Questions

Answers based on the source-checked product record

What is telemetry.dev?

telemetry.dev is an OpenTelemetry-based observability platform for AI applications and agents that monitors model calls, tool executions, retrievals, latency, errors, and token costs.

How can applications send traces to telemetry.dev?

Applications can ingest traces using the official TypeScript SDK, Python SDK, integration packages for OpenAI and Vercel AI SDK, or any exporter supporting OTLP/HTTP.

Can prompt and completion text be excluded from telemetry storage?

Yes, prompt capture can be disabled on a per-environment basis before data is stored, helping reduce prompt and completion contents from being retained.

What alerting options are available in telemetry.dev?

The platform provides email notifications triggered by budget thresholds, agent infinite loops, cost anomalies, and model or tool operational errors.

How does telemetry.dev support the Model Context Protocol?

telemetry.dev monitors MCP tool spans, failure rates, and p95 latency, while also offering a read-only MCP server for AI agents to query telemetry data.

Explore other recently added tools in the same category.