Claude Dashboards & Motion favicon

Claude Dashboards & Motion

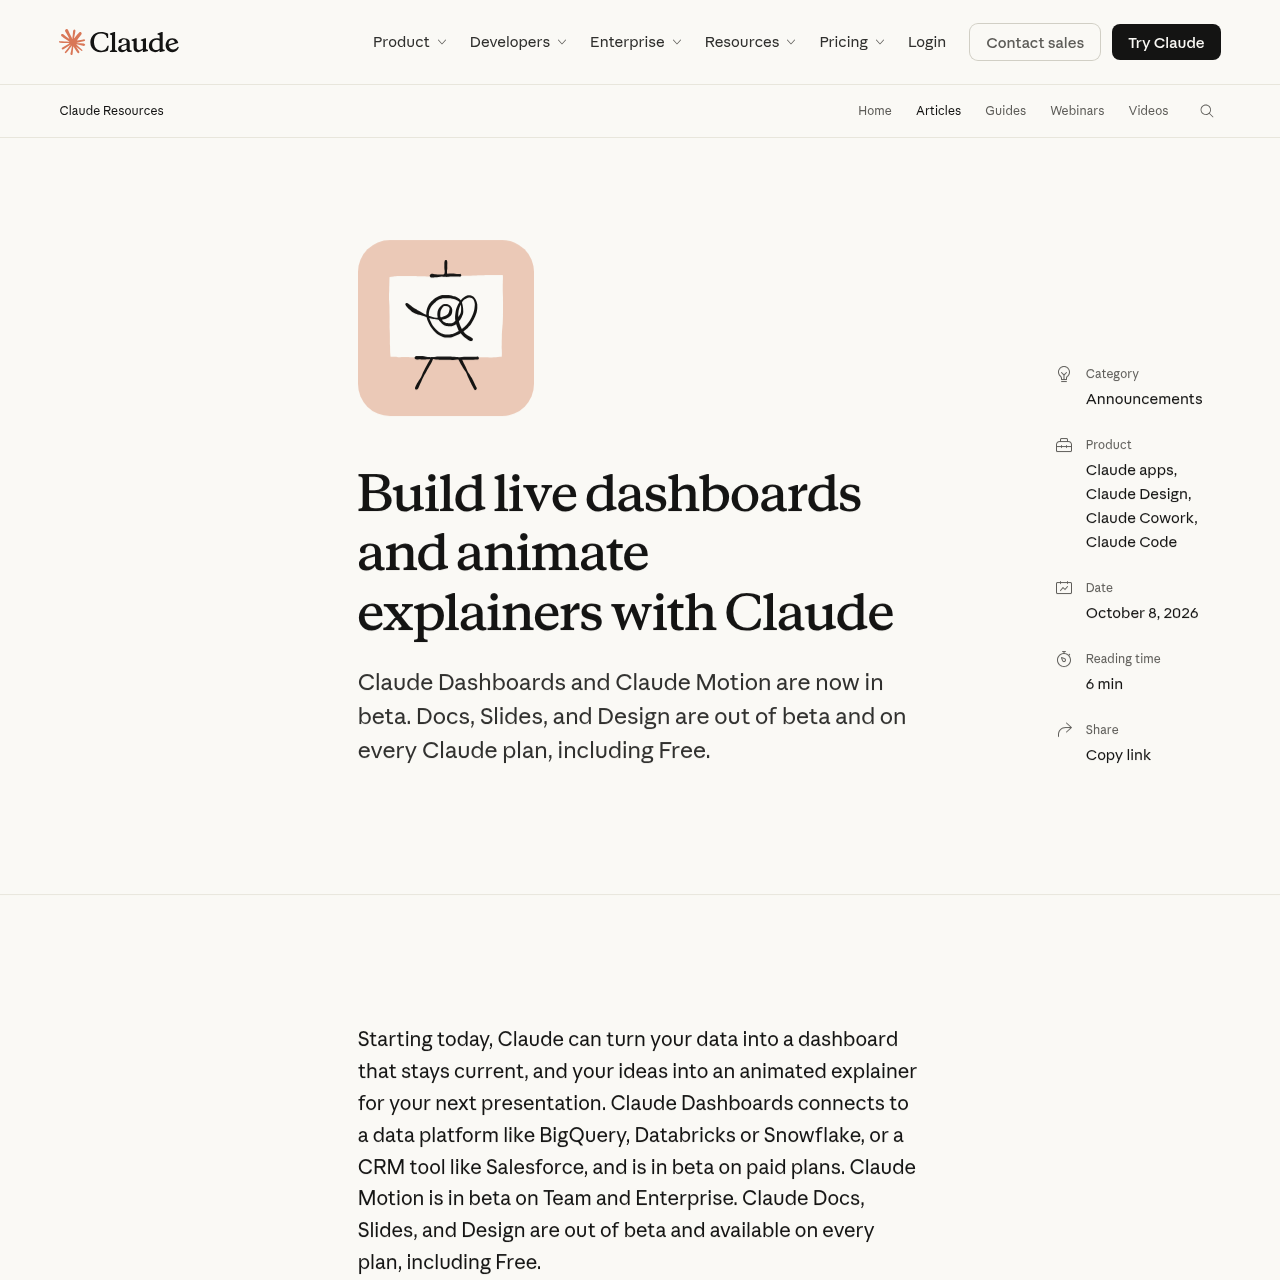
Claude Dashboards and Motion enable users to create live, query-backed data dashboards and code-driven video explainers directly from natural language prompts.

ProductivityGenerating live data dashboards from…Displaying underlying queries and…Explaining query logic upon user requestHandoff of dashboards to external…
Claude Dashboards & Motion product interface screenshot
Estimated monthly visits
132.5M
Data period:
Listed on AIToolly

What Is Claude Dashboards & Motion? Product Overview

What the product does and how it is positioned

Claude Dashboards and Claude Motion are beta capabilities designed to turn natural-language prompts into live business intelligence views and animated presentations. Dashboards connects directly to cloud data warehouses and CRM systems, letting users ask exploratory questions and receive automatically refreshed visual charts accompanied by their underlying queries.

Claude Motion transforms written reports, deck charts, and onboarding materials into code-based animations that play like short videos. Because it renders animations through programmatic code rather than AI video diffusion models, users retain fine-grained control over text, figures, and timing before exporting the output as MP4 video or moving it to external production tools.

What Can You Use Claude Dashboards & Motion For?

Source-supported ways to use the product

Exploratory Business Intelligence

Connecting data warehouses or Salesforce to ask exploratory questions like comparing periodic signups without writing SQL manually.

Animated Presentation Explainers

Converting quarterly reports or static board deck charts into 30-second animated video explainers for all-hands meetings.

Customer Onboarding Walkthroughs

Generating short animated walkthroughs from product prompts, editing the pacing and text, and exporting as MP4 files.

Live Data Connectivity and Analytics Tool Handoff

Claude Dashboards establishes direct connections to enterprise data infrastructure, including Amazon Redshift, BigQuery, ClickHouse, Databricks, and Snowflake, as well as CRM platforms like Salesforce. When users submit exploratory questions in plain language, Claude queries the data source, constructs the dashboard, and keeps the metrics refreshed as underlying records change.

To preserve analytical integrity, users can click any number to view the underlying database query, see when the chart was last refreshed, or ask Claude to explain the query logic. For workflows requiring deeper analytical exploration, dashboards can be transferred directly into third-party analytics platforms, including Amplitude, Grafana, Hex, Mixpanel, Omni, Perplexity, PostHog, and Sigma.

  • Direct connections to cloud data warehouses and CRM tools
  • Click-to-view transparency for underlying database queries
  • Visual indicators showing when data was last refreshed
  • Direct transfer pathways to eight third-party BI and analytics platforms

Code-Driven Animation and Video Export

Claude Motion generates animations programmatically by writing code to move text, charts, shapes, and images. Because it avoids video generation models, it produces no synthetic video footage or AI-generated human avatars, focusing entirely on animating the user's data and visual elements.

The code-based structure allows users to adjust wording, numerical figures, and timing directly in the editor or by prompting Claude. Once finalized, the animation can be downloaded as an MP4 file or transferred to video editing applications including Adobe, Descript, HeyGen, Higgsfield, invideo, Luma AI, and Runway.

  • Code-based animation structure eliminates synthetic footage and generated people
  • Granular user control over text, numbers, and animation timing
  • Direct MP4 file export capability
  • Integration handoffs to creative editing software

What to Test Before Choosing Claude Dashboards & Motion

Checks to run with your own material and workflow

  • Confirm that your organization uses supported data platforms, such as Amazon Redshift, BigQuery, ClickHouse, Databricks, Snowflake, or Salesforce.
  • Verify with your Enterprise administrator that Dashboards and Motion have been enabled within Organization settings under Artifacts.
  • Check whether your reporting workflows require upcoming connectors like Tableau, Looker, or monday.com prior to rollout.
  • Review whether code-driven shape and text animation meets your presentation goals without the need for generative video footage.

Claude Dashboards & Motion Sources and Last Checked

What was checked and when

Last checked
Category
Productivity

Claude Dashboards & Motion Frequently Asked Questions

Answers based on the source-checked product record

Which data sources are supported by Claude Dashboards?

Claude Dashboards connects to data platforms including Amazon Redshift, BigQuery, ClickHouse, Databricks, and Snowflake, as well as CRM platforms like Salesforce.

Does Claude Motion use generative AI video models?

No. Claude Motion writes code to animate text, charts, shapes, and images, and does not use video generation models, generated video footage, or AI-generated people.

Can users view the queries powering Claude Dashboards?

Yes. Users can click any number to inspect the query behind it, ask Claude to explain the query, and view the timestamp showing when the chart was last refreshed.

What formats and integrations are available for exporting animations?

Animations can be downloaded as MP4 files or opened directly in tools such as Adobe, Descript, HeyGen, Higgsfield, invideo, Luma AI, and Runway.

Are Dashboards and Motion turned on by default for Enterprise plans?

No. Dashboards and Motion are off by default for Enterprise organizations and must be manually enabled by an administrator under Organization settings in the Artifacts tab.

Explore other recently added tools in the same category.