ClawMetry for OpenClaw
ClawMetry: The Real-Time Open-Source Dashboard for Monitoring OpenClaw Agents
ClawMetry is a powerful, real-time dashboard designed specifically for OpenClaw. It provides complete visibility into agent activities, sub-agent processes, token usage, and tool calls. Free and open-source, ClawMetry helps developers track costs, monitor system health, and analyze session history across macOS, Linux, and Windows environments.
2026-02-20
--K

ClawMetry for OpenClaw Product Information
ClawMetry: The Ultimate Real-Time Dashboard for OpenClaw
Monitoring complex AI agents can often feel like working in the dark. When your OpenClaw agents spawn sub-agents, burn through tokens, or execute tool calls, you need immediate visibility. ClawMetry is the dedicated, open-source real-time dashboard for OpenClaw that ensures you know exactly what your agents are doing at any given second.
Designed to be free forever and MIT licensed, ClawMetry provides a "Mission Control" experience for your agentic workflows, eliminating the guesswork involved in agent orchestration.
What's ClawMetry?
ClawMetry is a comprehensive monitoring solution built specifically for the OpenClaw ecosystem. It provides a single-screen overview of everything happening across your agents. While OpenClaw handles the heavy lifting of agent execution, ClawMetry serves as the observation layer, displaying flows, sub-agent statuses, summaries, crons, and memory usage in a clean, intuitive interface.
Whether you are running agents on a local laptop or a remote server, ClawMetry hooks into the OpenClaw task system to provide live telemetry. It was built out of necessity to solve a common problem: the lack of transparency when an agent says it is "spawning a sub-agent."
Features of ClawMetry
Comprehensive Sub-Agent Monitoring
This is the core functionality of ClawMetry. Instead of hoping your sub-agents are working correctly, you can see every step they take in real-time. This includes:
- Files being read.
- Commands being executed.
- Specific tools being called.
- The underlying "thought" process of the agent.
- Narrative summaries and full logs for every step.
Live Flow Graphing
Visualize your entire architecture with a live flow graph. ClawMetry maps out channels, gateways, models, tools, and nodes. This graph updates dynamically as events occur, giving you a bird's-eye view of your OpenClaw infrastructure.
Token and Cost Tracking
Manage your budget effectively with granular financial data. ClawMetry tracks:
- Tokens in and tokens out.
- Cache hits and response times.
- Cost per individual call.
- Total cost breakdown per session, model, and tool.
System Health and Mission Control
Stay informed about the environment where your OpenClaw agents reside. The dashboard includes trackers for:
- Cron jobs and service uptime.
- Disk usage.
- Active sub-agent counts.
- Integration with OpenClaw's task system to see which agents are assigned to specific tasks.
Session History
Every interaction is logged for future review. You can browse through a complete timeline of past sessions to analyze tool calls, successes, failures, and total expenditures.
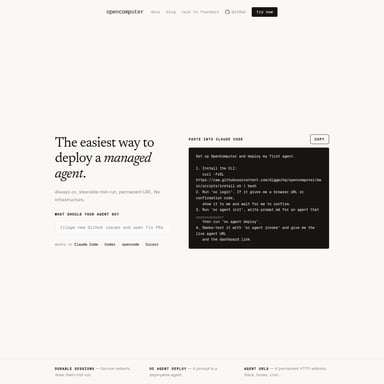
How to Use ClawMetry
Installing ClawMetry is designed to be a 30-second process, regardless of your operating system. The installer automatically detects if you are on macOS, Linux (Ubuntu, Debian), or Windows (including WSL).
Quick Start Installation
Using the One-liner (Linux/macOS)
For a fast setup on Unix-based systems, use the following command:
$ curl -fsSL https://clawmetry.com/install.sh | bash
Using pip (Python)
If you prefer using Python's package manager, you can install and run ClawMetry directly:
# Install it
$ pip install clawmetry

# Run it
$ clawmetry
Using PowerShell (Windows)
For Windows users, use this one-liner to get started quickly:
$ iwr -useb https://clawmetry.com/install.ps1 | iex
Using CMD (Windows)
If you are using the traditional Command Prompt, run:
> curl -fsSL https://clawmetry.com/install.cmd -o install.cmd && install.cmd && del install.cmd
Use Case Scenarios
Development and Debugging
When building new OpenClaw agents, developers use ClawMetry to debug tool calls and sub-agent spawning. By seeing exactly what a sub-agent is thinking and which files it is accessing, you can identify logic errors instantly rather than sifting through raw text logs.
Cost Management
For teams running high-volume agents, token costs can spiral quickly. ClawMetry allows managers to see the cost per call and session in real-time, enabling them to optimize model usage and tool efficiency before receiving a large invoice from model providers.
Production Monitoring
In a production environment, ClawMetry acts as a health monitor. It tracks cron jobs and system resource usage (like disk space) on platforms ranging from Raspberry Pi to AWS, ensuring that your OpenClaw deployment remains stable and responsive.
FAQ
Q: Is ClawMetry free to use? A: Yes, ClawMetry is open-source, MIT licensed, and free forever.
Q: Where can I run ClawMetry? A: You can run it anywhere OpenClaw runs. Supported environments include macOS, Ubuntu, Debian, Raspberry Pi, Windows (WSL), and cloud providers like Digital Ocean, AWS, GCP, Hostinger, and Hetzner.
Q: Does ClawMetry support real-time updates? A: Yes, the dashboard is designed to show you exactly what your agents are doing right now with a live flow graph and real-time activity logs.
Q: Do I need to build the dashboard myself? A: No. ClawMetry was built so you don't have to spend time creating your own monitoring tools. You can install it with a single command and have a full mission control center ready immediately.