
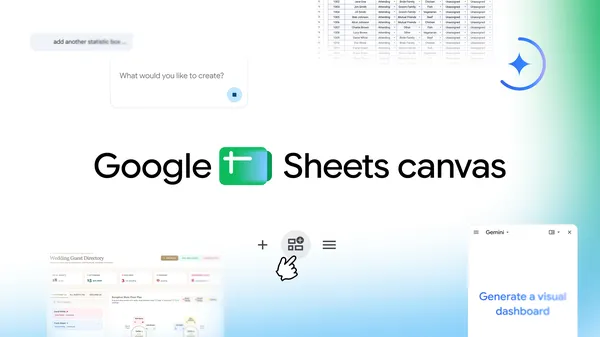
Google Workspace Unveils Sheets Canvas: Transforming Spreadsheet Data into Interactive Visuals with Simple Prompts
Google has announced the launch of "Sheets canvas," a new feature within Google Sheets designed to revolutionize how users interact with spreadsheet data. By utilizing simple natural language prompts, Sheets canvas allows users to transform static rows and columns into dynamic, interactive formats such as dashboards, custom study trackers, and seating charts. This update marks a significant shift in the Google Workspace ecosystem, moving beyond traditional grid-based data management toward a more visual and intuitive user experience. The feature aims to simplify the creation of complex organizational tools, making data more actionable and visually engaging for users across various sectors, from education to business management.
Key Takeaways
- Interactive Transformation: Sheets canvas allows users to turn standard spreadsheet data into interactive dashboards and visual tools.
- Prompt-Based Interface: The feature operates through simple natural language prompts, simplifying the creation of complex layouts.
- Versatile Use Cases: Google highlights specific applications including custom study trackers, seating charts, and interactive dashboards.
- Enhanced Data Engagement: The tool is designed to "bring data to life," moving away from static data entry toward dynamic, functional visualizations.
In-Depth Analysis
From Static Grids to Dynamic Canvases
The introduction of Sheets canvas represents a fundamental evolution in the philosophy of spreadsheet software. Traditionally, Google Sheets has been a tool defined by its grid structure—a series of cells, rows, and columns designed for data entry and calculation. While powerful, this format often requires significant manual effort to transform into a presentable or highly functional interface. Sheets canvas addresses this by introducing a layer of interactivity that sits atop the raw data. By allowing users to convert these grids into "canvases," Google is effectively turning the spreadsheet into a flexible development environment where the data serves as the foundation for a more sophisticated user interface.
This transition is particularly evident in the mention of interactive dashboards. In a standard spreadsheet, creating a dashboard often involves complex charting tools, pivot tables, and meticulous formatting. Sheets canvas appears to streamline this process, enabling the data to be visualized in a way that is not just readable, but interactive. This suggests a move toward "no-code" application development within the Google Workspace ecosystem, where the spreadsheet acts as the database and the canvas acts as the front-end interface.
The Power of Prompt-Based Customization
One of the most significant aspects of the Sheets canvas announcement is the reliance on "simple prompts" to generate layouts. This indicates a deep integration of generative AI or advanced automation within the Google Sheets workflow. Instead of manually building a seating chart or a study tracker—tasks that would typically involve merging cells, applying conditional formatting, and adjusting borders—users can now describe their needs in plain English.
For example, the ability to generate a seating chart from a list of names and a room layout via a prompt suggests that the system can understand the context of the data and apply appropriate spatial logic. Similarly, a "custom study tracker" implies a level of personalization where the AI can structure timelines, progress bars, and task lists based on the user's specific input. This prompt-driven approach lowers the barrier to entry for advanced spreadsheet functions, allowing users who may not be experts in formulas or formatting to create professional-grade organizational tools. It shifts the user's role from a "builder" to a "director," where the primary task is to define the goal rather than execute the technical steps.
Industry Impact
The launch of Sheets canvas has significant implications for the broader productivity software industry. By integrating prompt-based visualization directly into Google Sheets, Google is positioning itself at the forefront of the AI-driven workspace. This move directly challenges other spreadsheet and project management platforms that are also racing to incorporate generative AI features.
For the AI industry, this represents a practical application of Large Language Models (LLMs) and generative systems in a highly structured environment. It demonstrates how AI can be used not just for text generation or data analysis, but for UI/UX generation. The ability to translate a text prompt into a functional, interactive layout within a spreadsheet is a sophisticated use case that bridges the gap between natural language processing and software design. Furthermore, this feature reinforces the trend of "democratizing data," where complex data visualization and management tools become accessible to a wider audience, potentially reducing the reliance on specialized software for tasks like event planning, educational tracking, and business reporting.
Frequently Asked Questions
Question: What is the primary purpose of Sheets canvas in Google Sheets?
Sheets canvas is designed to turn static spreadsheet data into interactive, visual formats. It allows users to create dynamic tools like dashboards and trackers using simple natural language prompts, making data more engaging and easier to manage.
Question: What kind of layouts can be created using Sheets canvas?
According to Google, users can create a variety of interactive layouts, including custom study trackers, seating charts, and interactive dashboards. The feature is flexible enough to handle different types of data-driven organizational tasks.
Question: How does the prompt system work in Sheets canvas?
While specific technical details are based on the user's input, the system uses "simple prompts" to understand the user's intent. This allows the software to automatically generate the structure and visual elements of a dashboard or tracker without the user needing to perform manual formatting or complex coding.